Ayodeji Johnson Oroboade

Data Analyst Portfolio.
About me
I’m a data analyst passionate about turning complex data into actionable insights that drive real-world impact. My experience spans Python, SQL, Power BI, Tableau, and RapidMiner, applied across projects in healthcare, retail, insurance, and operations. I enjoy blending analytical rigor with storytelling to make data understandable, relevant, and decision-ready.
From exploring UK milk supply patterns to predicting Alzheimer’s progression, I thrive on curiosity-driven projects that uncover trends, guide strategy, and inform decisions. My approach combines data cleaning, statistical modelling, predictive analytics, and interactive visualisation to deliver actionable insights that are both technically robust and practically useful.
Skills
Data Analytics: Python, SQL, Excel, RapidMiner
Data Visualisation & BI: Tableau, Power BI, Looker Studio
Machine Learning & Predictive Modelling: LightGBM, Random Forest, RNN, LSTM, SARIMA
Statistical & Time-Series Analysis: Forecasting, Trend Analysis, Anomaly Detection
Data Storytelling & Communication: Dashboards, Reports, Stakeholder Presentations
Projects
1. Early Detection & Prognosis of Alzheimer’s Disease Using Predictive Analytics
Tools Used: Python, Pandas, Scikit-learn, LightGBM, Random Forest, TensorFlow/Keras, LSTM, RNN, SHAP, LIME
Focus: Predictive Modelling, Longitudinal Patient Trajectories, Explainable AI, Early Warning Systems
This research project leveraged longitudinal patient data from the Alzheimer’s Disease Neuroimaging Initiative (ADNI) to predict progression from Mild Cognitive Impairment (MCI) to Alzheimer’s Disease. Guided by CRISP-DM, the workflow included data preprocessing, feature engineering, model development, and interpretability analysis.
Traditional machine learning models (LightGBM, Random Forest) and deep learning approaches (RNN, LSTM) were applied to classify patients and model disease progression over time. The LSTM achieved the best overall performance (Recall: 83.7%, F1: 84.2%), capturing temporal dependencies in cognitive and biomarker trajectories.
Explainability techniques (SHAP, LIME) highlighted key features driving predictions, while an alert framework flagged sudden cognitive declines as early warning signals. The study demonstrates how predictive analytics can complement clinical judgement, providing actionable insights for patient monitoring and advancing data-driven approaches in neurological healthcare.
Predictive Analytics
2. UK Milk Supply Forecasting & Utilisation Analysis
Tools Used: Python, Pandas, SARIMA, Time Series Analysis, Data Visualisation, Exogenous Variables
Focus: Time Series Forecasting, Supply Chain Analytics, Policy Insight, Data Storytelling.
This project stemmed out of curiosity, I analysed long-term UK dairy production data sourced from GOV.UK to understand patterns in raw milk availability, utilisation, and wastage across the supply chain. I conducted extensive time-series exploration spanning multiple decades, addressing structural changes, seasonality, and missing values inherent in historical government datasets.
Using SARIMA modelling, I forecasted short-term raw milk availability while capturing strong annual production cycles and temporal dependence. I further incorporated trade-related exogenous factors imports and exports, to contextualise domestic supply dynamics and assess their influence on availability. Visualisations highlighted periods where rising exports coincided with increased volatility in domestic supply, reinforcing the relevance of external drivers. The project demonstrates how statistical forecasting can support evidence-based decision-making in agriculture, offering insights applicable to farmers, industry planners, and policymakers concerned with food security, sustainability, and climate-sensitive production systems.
Milk Utilisation.
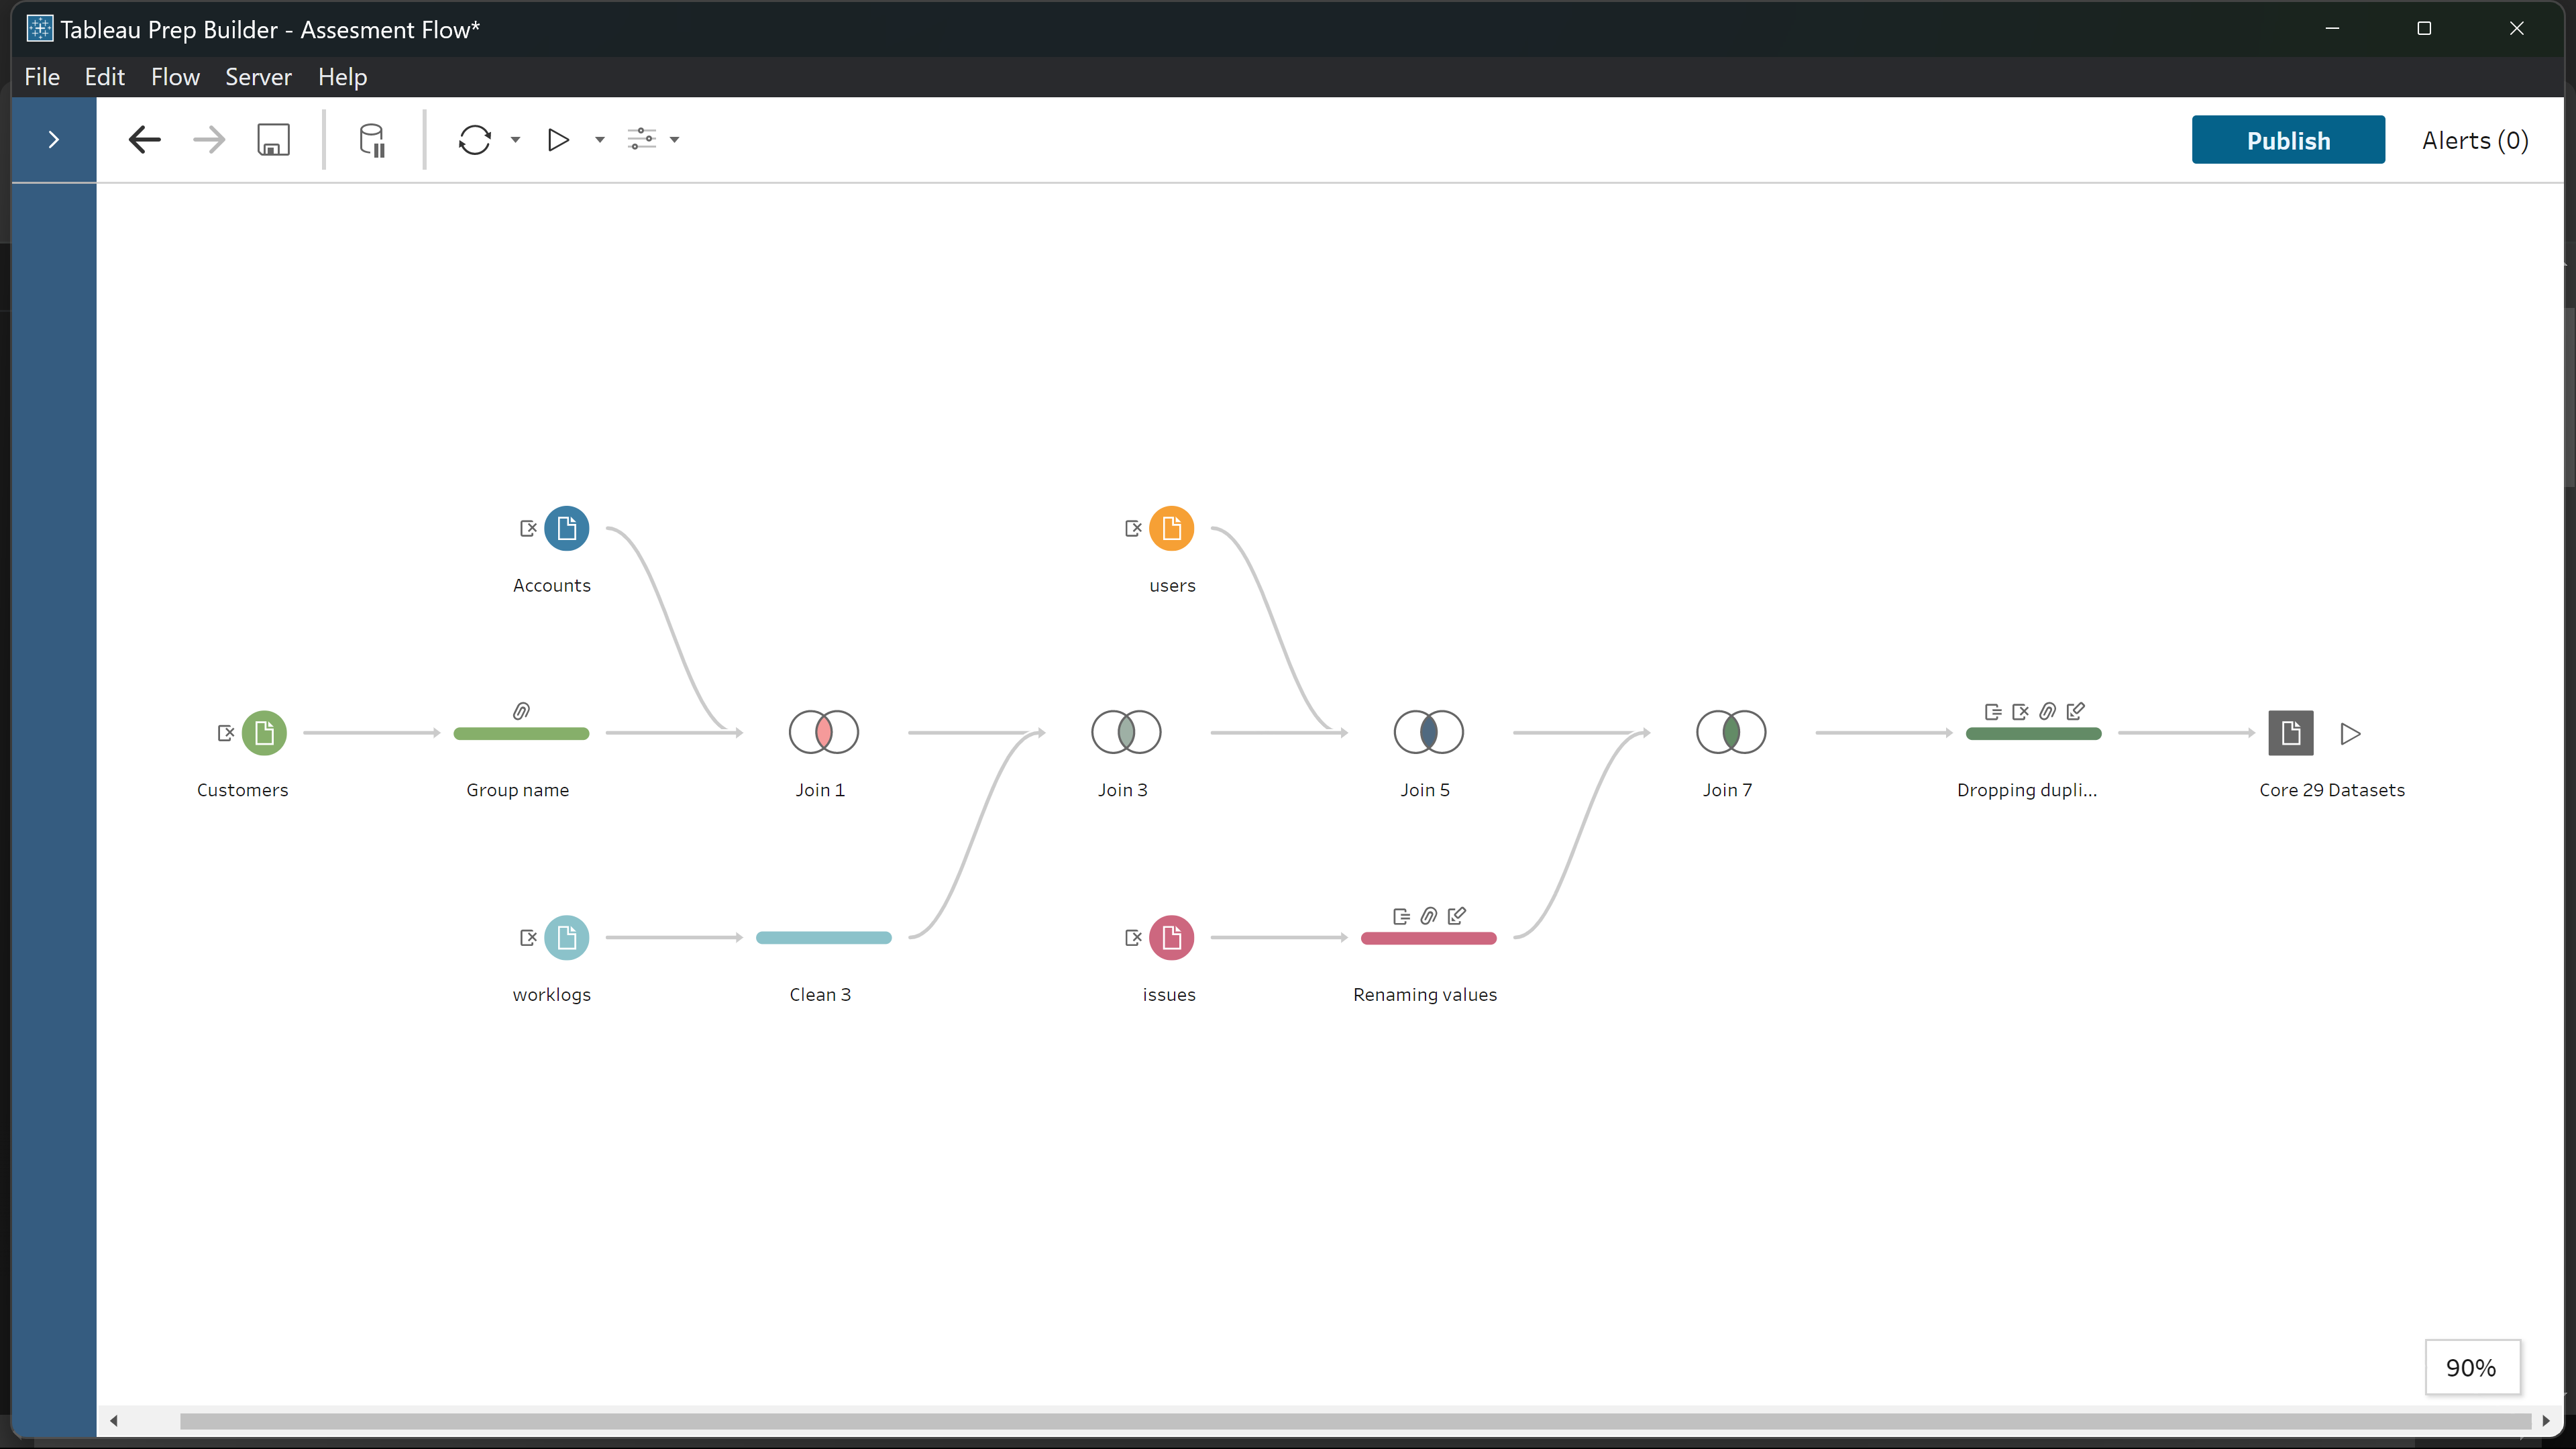
3. Core 29: Business Intelligence Dashboard: Work utilization, Project Status.
Tool: Tableau
The project focused on building insightful dashboards for Core29, a tech-driven project management company, to visualize team performance and project progress. I analyzed data on billable hours, workloads, project durations, and issue tracking to uncover imbalances in employee utilization and highlight key performance indicators. By utilizing Tableau, I revealed that some team members were overworked while others were underutilized. The dashboards also provided clarity on project statuses and other KPIs. These insights helped the client identify bottlenecks, improve team efficiency, and align project management strategies with business goals.
Team Utilization.
Project Utilization
Data Cleaning Process.
4. Optimising Insurance Claim in Autoinsurance.
Tool: Python via google colab.
The project focused on analyzing four years of insurance data (2015–2018) to identify trends in policyholder behavior, claim frequency, and overall policy performance. With a 13% rise in auto insurance claims reported in late 2024, insurers face growing financial pressure. I explored relationships between premiums, vehicle type, location, and claims using Python (Pandas, Seaborn, Plotly). A secondary dataset added insight into specific claim types like theft or accidents. The analysis revealed patterns that support better pricing, fraud detection, and customer segmentation. This project demonstrates my ability to transform raw data into practical strategies that improve financial stability in insurance.
Project Code
5. Database Management System.
Tool: SQL via MySQL
This project is a relational database management system for Inchgarth Community Centre to manage room bookings and activity attendance. I designed key tables such as Activity, Attendance, Bookings, Members, Membership, Payment, Rooms, and Staff, establishing relationships through foreign keys and primary keys. For example, the Activity table was linked to Attendance via a foreign key, and Members were connected to Membership. I implemented constraints on different columns like membership status and date/time to ensure data integrity. Additionally, we performed pilot testing using complex SQL queries and joining tables to ensure the system was running smoothly.
Database Codes
Data Base ER diagram
Database Queries
6. Customer Discount Campaign for Altrix Superstore
Tools Used: RapidMiner, Logistic Regression, Data Cleaning, Classification Models
Focus: Predictive Modeling, Data Storytelling, Customer Segmentation
This project tackled a real-world business challenge for Altrix Superstore, which aimed to identify which customers were most likely to accept a discounted gold membership offer. I began with deep data exploration on a customer dataset containing 2,240 records and 22 variables, covering demographics, spending behavior, and past complaints.
After resolving missing values and transforming variables for analysis, I tested three classification models: Logistic Regression, Decision Trees, and K-Nearest Neighbors. Logistic Regression performed best, with 84.3% accuracy, 72% recall, 48% precision, and an AUC score of 0.878.
The model revealed key predictors such as education level (PhD, Masters), presence of children at home, marital status (Widow), complaint history, and web visit frequency. Interestingly, income was not a significant factor in the prediction.
Throughout the project, I recorded a video walkthrough for stakeholders, guiding them through my thought process, modeling decisions, and business implications in a clear, accessible way. The final deliverable included actionable recommendations, model deployment strategies, and communication materials to support the campaign launch.